Introduction:
In the dynamic world of the stock market, where trends can change in the blink of an eye, traders and investors often seek reliable indicators to make informed decisions. One such powerful yet simple tool in the technical analysis toolkit is the "Hammer" candlestick pattern. This blog aims to unravel the significance of the Hammer candle and how it can be a valuable asset for traders navigating the tumultuous waters of the share market.
Understanding the Hammer Candlestick:
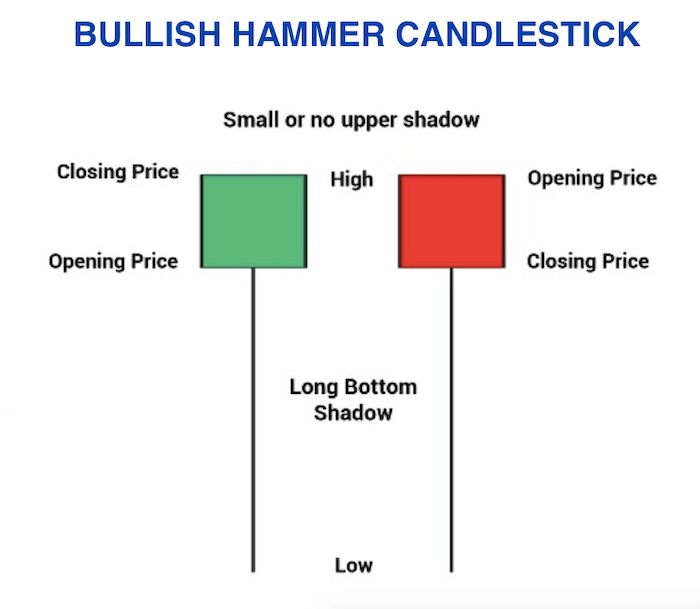
The Hammer is a single candlestick pattern that typically appears after a downtrend. It consists of a small body, a long lower shadow, and little to no upper shadow. The formation resembles a hammer, with the body representing the head and the lower shadow the handle. This pattern signals a potential reversal in the prevailing trend.
Key Characteristics of a Hammer Candle:
Small Body:
The body of the candle is usually small, indicating a narrow range between the open and close prices.
Long Lower Shadow:
The long lower shadow is a crucial component, suggesting that sellers pushed prices significantly lower during the session but failed to maintain control by the close.
Little to No Upper Shadow:
The absence or minimal presence of an upper shadow emphasizes the bullish sentiment.
Interpreting the Hammer in Market Context:
When a Hammer candle appears after a downtrend, it implies that sellers dominated the market initially, driving prices lower. However, buyers entered the scene towards the end of the session, pushing the prices back up and creating the long lower shadow. This reversal in momentum signals a potential change in sentiment from bearish to bullish.
Trading Strategies with the Hammer Candle:
Confirmation is Key:
While the Hammer suggests a potential reversal, it is crucial to wait for confirmation. This could come in the form of a bullish candle on the following trading day.
Support and Resistance:
Look for Hammers near key support levels, as this strengthens the potential for a reversal.
Volume Analysis:
Higher trading volume during the formation of a Hammer enhances its reliability, indicating increased market interest in the potential reversal.
Conclusion:
The Hammer candlestick pattern is a valuable tool for traders seeking to identify potential trend reversals in the share market. However, like any technical indicator, it is not foolproof and should be used in conjunction with other analysis tools. By understanding the psychology behind the Hammer and incorporating it into a comprehensive trading strategy, investors can enhance their ability to make well-informed decisions in the ever-changing landscape of the stock market.


Post a Comment